Data Logger
Select Data Logger to log measurements over time and chart the captured traces.
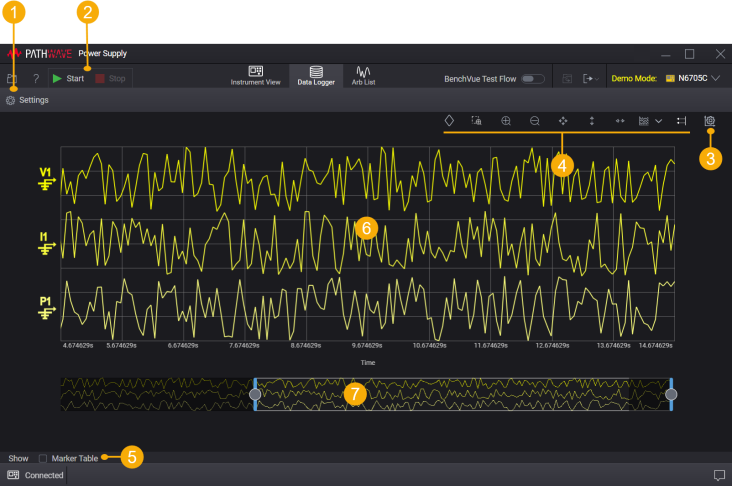
| 1 | Settings – Show or hide the Settings tab to change settings for data logging. |
| 2 | Start, Stop – Start and stop data logging. |
| 3 | Change Trace Display Settings. |
| 4 | Chart Controls and add Markers for the display. |
| 5 | Select Show Marker Table to display calculated measurements. |
| 6 | Mouse over the traces to display readings at a point in time. |
| 7 | The Data Preview Bar gives a visual indication of the portion of the data that is currently displayed in the chart. See Data Preview Bar. |
During data logging, the computer's clock controls measurement start/stop/interval, and readings are stored in a data log on the computer.
The data log file size depends on the number of data points, traces, and captures. Make sure your computer has sufficient disk space when performing data logging.
If your IO connection is especially slow or if communication is disrupted, you will likely experience timing issues during data logging. To avoid these timing issues, be sure your IO connection is adequate and increase your sample period as needed.